
Seller's Market vs. Buyer's Market: What the Distinction Really Means
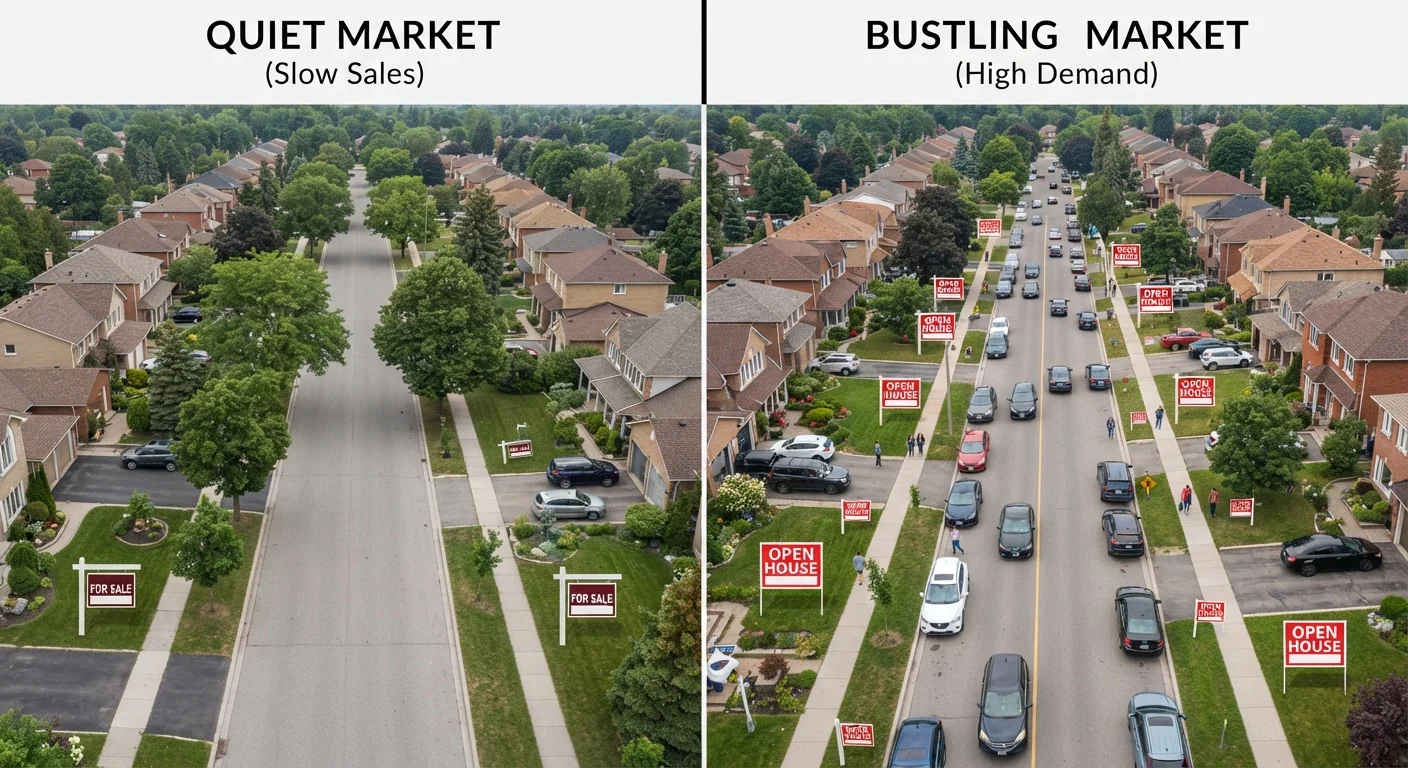
Photo credit: SearchLynk.net | Search Made Easier
In this article
These two labels show up in every housing headline. Here's what they actually mean for prices, negotiation, and how long homes sit unsold.
Key Takeaways
- A seller's market means more buyers than available homes, pushing prices up and cutting negotiation room.
- A buyer's market means more homes than active buyers, giving purchasers leverage on price and terms.
- Months of supply - typically below 6 for seller's, above 6 for buyer's - is the key indicator analysts watch.
- Local conditions can differ sharply from national headlines; always examine your specific metro or ZIP code.
- Neither market type is permanent; conditions shift with interest rates, employment, and new construction.
The Core Distinction: Supply, Demand, and Leverage
Every housing market sits on a spectrum between two poles: one where sellers hold the advantage, and one where buyers do. Understanding which pole your local market sits closer to is essential for interpreting prices, offer dynamics, and how long homes linger unsold.
A seller's market occurs when the number of buyers actively seeking homes exceeds the inventory available. Competition among buyers intensifies, homes sell quickly, and sellers frequently receive multiple offers - sometimes above their asking price. Contingencies such as inspection clauses or financing conditions may be waived by buyers eager to win deals.
A buyer's market is the reverse. When housing supply outpaces demand, sellers compete for a smaller pool of purchasers. Homes sit on the market longer, list prices are more negotiable, and buyers can reasonably request concessions - closing cost assistance, repairs, or price reductions - as conditions of their offer.
For a deeper grounding in the forces that produce these conditions, see how the US housing market actually works.
| Criterion | Seller's Market | Buyer's Market |
|---|---|---|
| Months of Supply | Under 6 months | Over 6 months |
| Days on Market | Short - days to a few weeks | Long - often 60+ days |
| Price Trajectory | Rising; often above list | Flat or falling; below list common |
| Negotiating Power | Seller holds leverage | Buyer holds leverage |
| Contingencies | Buyers often waive them | Buyers can include full contingencies |
| Seller Concessions | Rare or minimal | Common - repairs, closing costs |
| Offer Competition | Multiple offers typical | Single or few offers common |
How Analysts Measure Which Market You're In
The most widely used metric for classifying market conditions is months of supply - the number of months it would take to sell all current listings at the current pace of sales, assuming no new homes entered the market. Broadly speaking, analysts treat six months of supply as a balanced market. Below six months signals seller's market territory; above six months points toward a buyer's market.
Days on market (DOM) - how long a home sits listed before going under contract - is a complementary signal. Homes selling in days or a week or two indicate strong seller conditions. Homes sitting for 60, 90, or more days suggest buyer leverage is building.
List-price-to-sale-price ratios offer a third lens. In a strong seller's market, sale prices routinely exceed list prices. In a buyer's market, final sale prices typically land below original asking prices.
6 months
Supply threshold for a balanced market
The National Association of Realtors uses six months of supply as the conventional dividing line between buyer and seller conditions.
~3 months
Typical US supply during recent seller's markets
In periods of acute inventory shortage, national months-of-supply figures have fallen well below the six-month balance point, according to industry data.
100%+
Sale-to-list price ratio in competitive seller's markets
When sale-to-list ratios exceed 100%, the average home is selling above its asking price - a defining characteristic of a heated seller's market.
For more on how these metrics are defined and reported, the housing market terminology reference covers inventory, absorption rate, and related concepts in plain English.
What Each Market Means for Prices and Negotiation
In a seller's market, asking prices tend to function as floors rather than ceilings. Bidding wars push final sale prices upward, and sellers gain the ability to set stricter terms - shorter inspection periods, as-is sales, or rent-back agreements that let them stay in the home after closing.
In a buyer's market, asking prices become starting points for negotiation. A buyer can submit an offer below list price and anticipate a counteroffer rather than rejection. Sellers become more willing to cover closing costs or address inspection findings to keep a deal alive. The relationship between housing inventory and pricing explains why supply levels have such a direct effect on these dynamics.
One important nuance: even within a buyer's market, desirable, well-priced homes in strong school districts or low-crime neighborhoods can still attract competitive offers. Market conditions describe overall tendencies, not guaranteed outcomes for every property.
Why National Labels Don't Always Match Local Reality
Housing markets are intensely local. National reports describing a seller's market may obscure the fact that specific metros or ZIP codes are already shifting toward balance - or deeper into buyer territory. A metro experiencing significant job losses may tip toward buyer conditions even as national inventory remains tight.
This is one of the most common errors readers make when processing housing headlines. Misreading national data as local fact leads to faulty conclusions - a risk worth guarding against whether you are buying, selling, or simply following the market.
National vs. Local Market Conditions
A headline stating the US is in a seller's market reflects aggregated national data - it does not mean every city, county, or neighborhood is experiencing identical conditions. Markets within the same metro can diverge significantly based on price tier, school district, and proximity to employment centers. Always seek local inventory and DOM data before drawing conclusions about your specific area.
Market conditions also shift over time. Interest rate movements, employment trends, and new construction pipelines all redistribute leverage between buyers and sellers. If you are navigating a seller's market as a buyer right now, strategies for competing in a seller's market outlines approaches that keep offers competitive without overextending financially.
This article is for general informational and educational purposes only. It does not constitute financial, legal, or real estate advice. Readers should consult qualified professionals before making housing decisions.

Author
Real Estate Editorial Team
Real Estate Editorial Team is the collective byline for our editorial team and contributor network. Articles published under this byline or an editorial pen name are researched, written, and reviewed according to our editorial standards for clarity, consistency, and independence before publication.
View all articles →