
New Construction vs. Existing Homes: How Each Segment Moves the Market
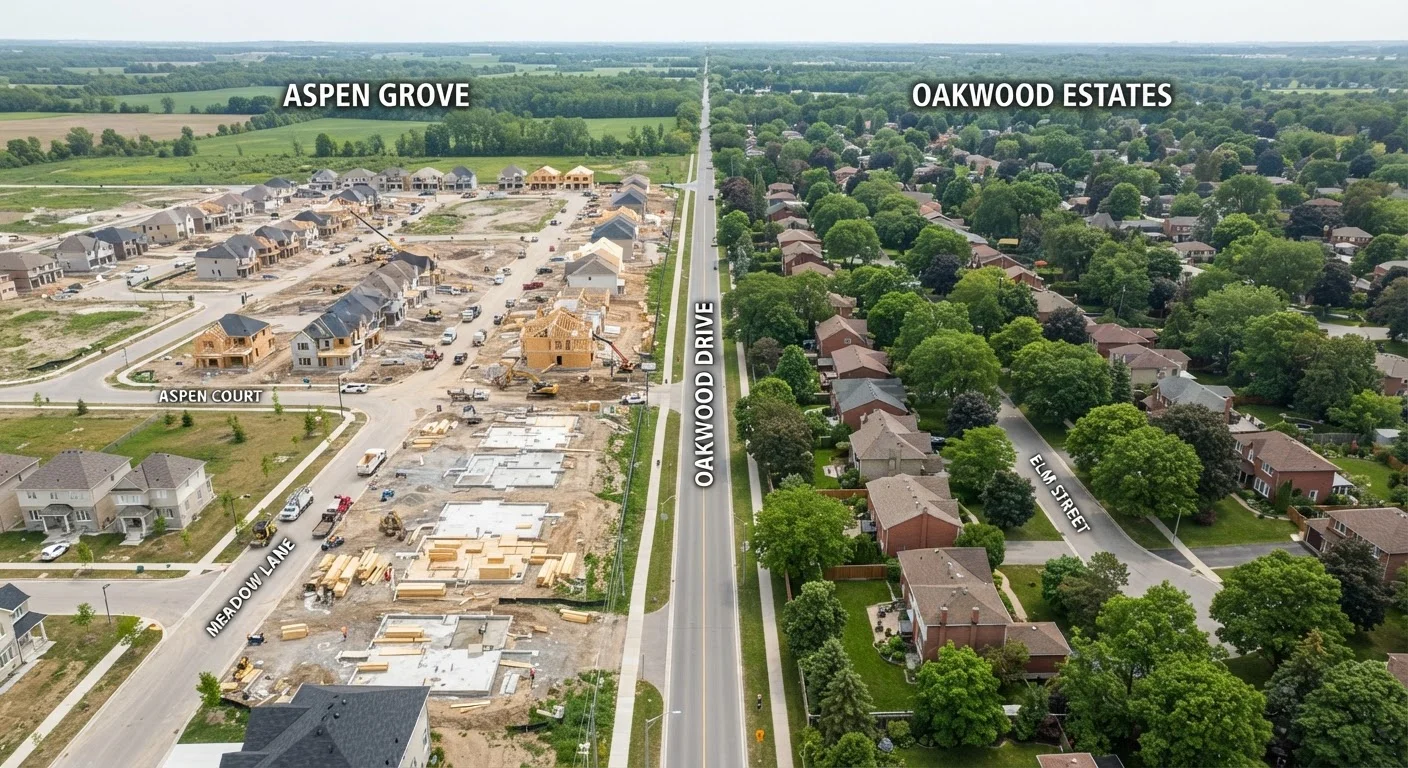
Photo credit: SearchLynk.net | Search Made Easier
In this article
New builds and resales respond differently to economic conditions. Understanding both helps you interpret housing data more accurately.
Key Takeaways
- New construction and existing home sales are tracked separately and tell different stories about market health.
- Builder activity is sensitive to interest rates, labor costs, and land availability in ways that resale markets are not.
- Existing home sales dominate volume, making them the primary indicator economists watch for market direction.
- Supply constraints in both segments can reinforce each other, amplifying affordability pressures.
- Understanding both segments together gives a more accurate picture than either data point alone.
Two Separate Markets, Two Separate Datasets
When the media reports on home sales, they are almost never talking about a single unified market. The U.S. housing sector is tracked in two distinct segments: new construction (homes built by developers and sold for the first time) and existing homes (previously owned properties resold through the market). Each segment has its own data source, its own economic drivers, and its own relationship to broader conditions.
New construction figures come primarily from the U.S. Census Bureau, which reports housing starts (when ground breaks), building permits (a leading indicator of future supply), and new home sales. Existing home sales are reported by the National Association of Realtors (NAR) and reflect completed transactions on previously owned properties. Because existing homes make up roughly 85-90% of all sales activity in a typical year, that dataset tends to dominate housing headlines - but new construction data often tells you more about where the market is heading.
For a deeper look at how supply metrics fit into the broader picture, see how housing inventory is measured.
What Drives Each Segment
The forces that move new construction differ substantially from those that drive resale activity.
New Construction Drivers
- Builder confidence and financing costs: Developers must finance land acquisition and construction before a single home is sold. When borrowing costs rise sharply, projects that penciled out at lower rates may be delayed or canceled.
- Labor and material costs: Skilled trade shortages and commodity price swings directly affect a builder's margin and timeline in ways that don't apply to a homeowner selling an existing property.
- Land availability and zoning: Regulatory constraints on where and what can be built create long structural lags in supply response, even when demand is strong.
Existing Home Sale Drivers
- Mortgage rate sensitivity: When rates rise quickly, owners with low fixed-rate mortgages often choose not to sell - a dynamic sometimes called the lock-in effect - which suppresses resale inventory regardless of buyer demand.
- Life events and local labor markets: Job changes, family growth, and retirement decisions drive resale supply in ways that are more personal and less predictable than builder economics.
- Consumer confidence: Buyers are more likely to transact when they feel financially secure, making existing home sales a useful barometer of near-term economic sentiment.
| New Construction | Existing Homes | |
|---|---|---|
| Share of total sales | ~10-15% of annual transactions | ~85-90% of annual transactions |
| Primary data source | U.S. Census Bureau | National Association of Realtors |
| Market signal type | Leading indicator (permits, starts) | Coincident/lagging indicator |
| Key sensitivity | Builder costs, land, financing | Mortgage rates, lock-in effect |
| Supply response speed | Slow - months to years | Faster - depends on seller motivation |
| Price negotiation dynamics | Builder incentives possible (e.g., rate buydowns) | Owner-to-owner negotiation |
How Each Segment Signals Market Direction
Because builders commit capital over long timelines, new construction data functions as a leading indicator - it often signals where the market is going before existing home data confirms it. A sustained drop in housing permits, for example, typically foreshadows tighter inventory six to eighteen months later. Conversely, a pickup in starts can signal that developers expect demand to hold or grow.
Existing home sales, by contrast, are a coincident or slightly lagging indicator. They reflect decisions buyers and sellers made weeks or months earlier when they signed contracts, meaning a sharp drop in sales often shows up in the data after rates or confidence have already shifted.
~85-90%
Existing homes' share of annual US sales
The National Association of Realtors consistently reports that previously owned homes make up the large majority of all residential transactions.
6-18 months
Typical lag from permit to market impact
Housing economists generally estimate that permit activity takes six to eighteen months to translate into completed homes available for sale.
When both segments slow simultaneously, it typically signals a broad market cooldown. When new construction holds up while resale volume falls, it often points to the lock-in effect constraining resale supply rather than a collapse in buyer demand. Understanding whether it's a seller's or buyer's market depends heavily on reading both signals in tandem.
Putting the Data in Context as a Reader
Housing headlines often cite a single number - "home sales fell 8% last month" - without specifying which segment is being measured or why. A drop in existing home sales driven by rate-induced lock-in is a very different story from a drop caused by weakening demand. Similarly, a rise in new home sales could reflect genuine demand or simply builders offering rate buydowns and price concessions to move inventory.
A few habits help when reading housing reports:
- Identify whether the data refers to new or existing homes before drawing conclusions.
- Look at permits and starts alongside sales figures for a forward-looking read on supply.
- Compare year-over-year figures rather than month-over-month alone, since seasonal patterns can distort short-term reads. Seasonal patterns in home sales explain much of the monthly volatility you'll see in reports.
- Consider median sale price alongside volume - prices can hold steady even as transaction counts fall.
For a practical framework on navigating monthly data releases, see how to read a housing market report. And if you're deciding what this means for your own situation, the renting vs. buying trade-offs are worth exploring alongside market conditions. Additional guidance for those actively considering a purchase is available at the buying a home hub.

Author
Real Estate Editorial Team
Real Estate Editorial Team is the collective byline for our editorial team and contributor network. Articles published under this byline or an editorial pen name are researched, written, and reviewed according to our editorial standards for clarity, consistency, and independence before publication.
View all articles →