
Where Does Your Money Actually Go? Understanding Spending Categories
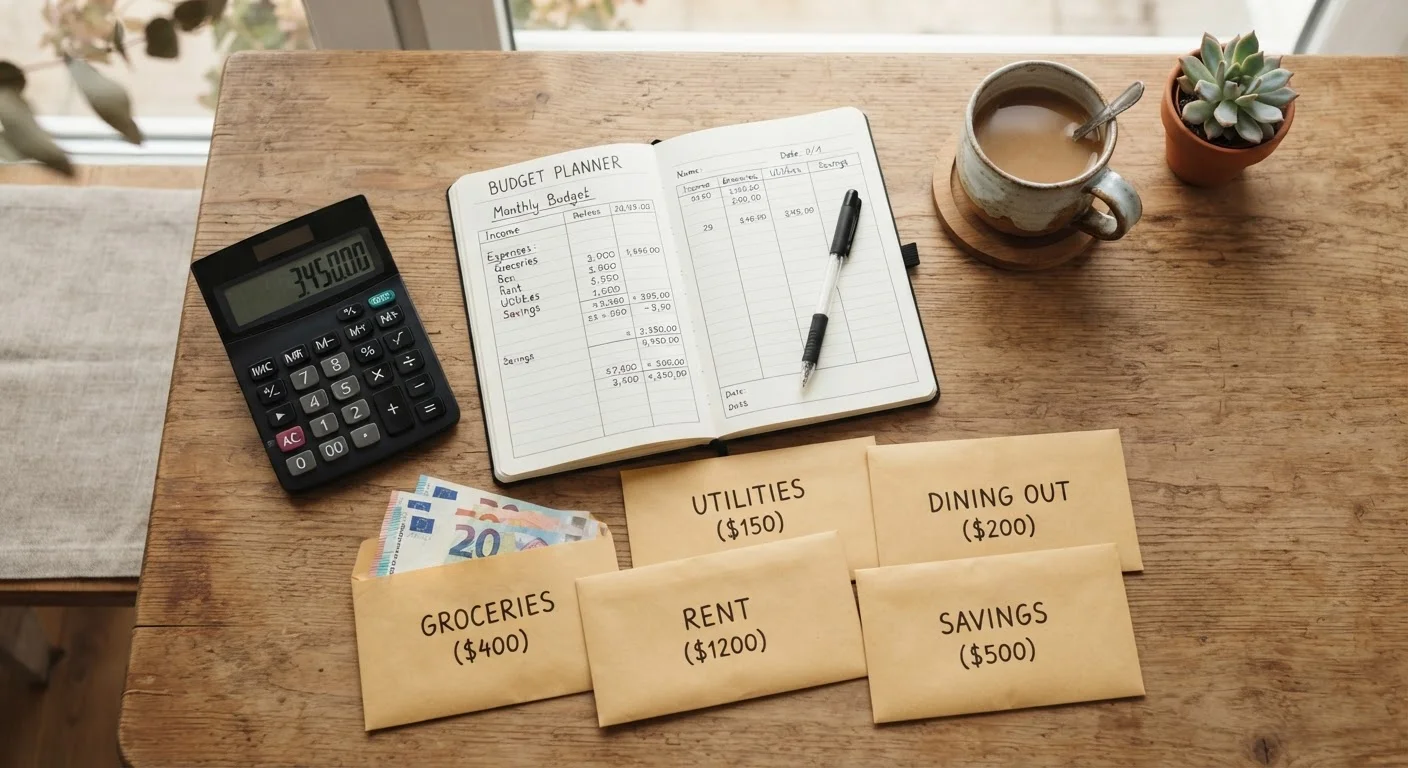
Photo credit: SearchLynk.net | Search Made Easier
In this article
Learn how personal finance experts group everyday expenses and why categorizing your spending is the first step to a workable budget.
Key Takeaways
- Spending categories group every expense so you can see patterns and spot imbalances quickly.
- Most personal budgets organize expenses into three tiers: needs, wants, and savings or debt repayment.
- Housing, food, and transportation typically consume the largest share of household spending.
- Tracking even small irregular expenses - subscriptions, copays - prevents budget gaps.
- Choosing a consistent category system matters more than which specific system you use.
Why Categorizing Expenses Changes Everything
Most people have a general sense that they spend money on rent, groceries, and gas - but without a structured category system, the details blur. Credit card statements list every charge chronologically, not by purpose. Bank apps may tag transactions automatically, but those tags rarely match the way you think about your own financial life.
Grouping expenses into named categories does two things at once: it converts raw transaction data into meaningful information, and it creates a framework you can compare month over month. Once you know that food spending jumped 22% in December, you can make a deliberate choice about whether that was worth it - rather than wondering where the money went.
This is why virtually every personal budgeting system - from the envelope method to modern app-based tracking - starts with the same foundational step: defining your categories. See our comprehensive introduction to personal budgeting for a deeper look at building that system from scratch.
33%
Average share of income spent on housing
According to U.S. Bureau of Labor Statistics Consumer Expenditure data, housing consistently represents the largest single spending category for American households.
~13%
Share of household spending on food
The U.S. Bureau of Labor Statistics reports that food - combining groceries and dining out - typically accounts for around 12-14% of average household expenditures.
17%
Average share spent on transportation
BLS Consumer Expenditure surveys consistently rank transportation as the second-largest spending category for most American households.
The Core Spending Categories Most Budgets Use
While every household is different, personal finance educators generally organize spending into a consistent set of core categories. Understanding each one helps you decide how to adapt them to your own life.
Housing
Rent or mortgage payments, property taxes, homeowner's or renter's insurance, and HOA fees all fall here. For most Americans, this is the single largest category - often 25-35% of take-home pay.
Food
This typically splits into groceries (food purchased to cook at home) and dining out (restaurants, takeout, delivery apps). Keeping these separate reveals a common budget leak: frequent small restaurant purchases that add up significantly.
Transportation
Car payments, fuel, auto insurance, maintenance, parking, and public transit costs belong here. Transportation is notable because it contains both fixed costs (a car payment) and variable ones (fuel and repairs). For more on that distinction, see how fixed and variable expenses differ.
Healthcare
Insurance premiums not taken directly from your paycheck, copays, prescriptions, dental, and vision care fit in this category. Healthcare costs vary enormously by age, employer coverage, and health status.
Utilities and Bills
Electricity, gas, water, internet, phone, and streaming or software subscriptions. Many budgeters track recurring subscriptions carefully because they are easy to accumulate and easy to forget.
Personal and Family
Clothing, personal care products, haircuts, childcare, and pet expenses. These are often underestimated in early budgets.
Savings and Debt Repayment
This is not optional. Treating contributions to an emergency fund, retirement account, or debt payoff plan as a category - not an afterthought - is what separates budgets that work from those that don't. If you're weighing these two goals, our article on the emergency fund vs. paying off debt trade-off walks through the key considerations.
The Needs vs. Wants Framework
One of the most durable ways to organize spending categories is the needs-versus-wants distinction, most commonly expressed through the 50/30/20 rule. Under this framework:
- Needs (roughly 50% of after-tax income): Expenses that are genuinely non-negotiable - housing, basic food, utilities, minimum debt payments, and essential healthcare.
- Wants (roughly 30%): Lifestyle spending that improves quality of life but isn't strictly required - dining out, entertainment, gym memberships, travel.
- Savings and debt repayment (roughly 20%): Contributions beyond minimum debt payments, retirement savings, and emergency fund building.
These percentages are guidelines, not rules. Someone in a high cost-of-living city may find that housing alone consumes 40% of income, requiring adjustments elsewhere. The framework is most useful as a diagnostic tool: if your needs consistently exceed 60% of income, that signals a structural issue worth addressing.
Irregular and Overlooked Expenses
One of the most common reasons budgets fail is what planners call "budget amnesia" - forgetting expenses that don't appear every month. Car registration, annual insurance renewals, holiday gifts, school supplies, and medical deductibles are real costs. They just don't show up in a tidy monthly pattern.
The fix is a category called a sinking fund or periodic expenses account. You estimate the annual total for these irregular costs, divide by 12, and set that amount aside each month. When the bill arrives, the money is already waiting.
Build a Simple Periodic Expense Tracker
List every non-monthly bill you paid in the past 12 months - insurance premiums, registration fees, annual subscriptions, holiday spending. Add them up, divide by 12, and that's your monthly sinking fund contribution. Even a rough estimate prevents most budget surprises.
Subscription creep is a related problem. A single $12 streaming service is easy to absorb; six of them add up to nearly $900 a year. Auditing recurring charges every quarter - and deciding which still earn their place - is one of the faster ways to reclaim budget room. The same logic applies to shopping habits: switching strategically between generic and name-brand products can generate meaningful savings within your food and personal care categories.
This article is intended for general informational and educational purposes only. It does not constitute personalized financial advice. For guidance specific to your financial situation, consult a qualified financial professional.
Frequently Asked Questions

Author
Finance Editorial Team
Finance Editorial Team is the collective byline for our editorial team and contributor network. Articles published under this byline or an editorial pen name are researched, written, and reviewed according to our editorial standards for clarity, consistency, and independence before publication.
View all articles →